

Reverse Engineering Hello World
Want to know more about how assembly code works, and how Windows executable programs are put together? I thought it would be fun to write a “hello world” program in C, and then examine it with some common reversing tools, to get a better understanding of what’s happening under the hood. To keep things interesting, the example program generates a simple secret code from a name that’s entered, instead of being a true “hello world” that only prints a fixed message. Follow along with me, and we’ll look at the disassembled program listing to reverse engineer the secret code algorithm, just like super 1337 haxors!
The example program for Windows runs in a console window, and is a 32-bit text-only application. It was written in plain C, and compiled in release mode with Microsoft Visual Studio Express 2012 for Windows. The C runtime library was Microsoft’s multi-threaded DLL version. In an effort to produce assembled code that was small and easy to understand, I turned off all the advanced compiler and linker options that I could.
Instead of “hello world”, I should have called the example “hello bloat”, because the 18 lines of C code resulted in a 6144 byte executable program. Huh? If you estimate that each line of C code might compile into 3 or so CPU instructions, each of which is an average of 4 bytes, then you might have expected a total executable size of about 200 bytes. If you predicted that there’s also some type of executable header, and maybe some extra code to handle interfacing with the C runtime DLL, and things like string literals and other constants, then you might have expected a total size of 400 or 500 bytes, but 6144 is hard to explain. Let’s look at what fills all those bytes later, and start by examining the heart of the program where the secret code algorithm lies.
Reversing with OllyDbg
OllyDbg is a free Windows debugging tool written by Oleh Yuschuk, and it’s designed for situations where no source code is available. As such, it’s popular with reversers who want to examine an unknown executable program, and learn what’s happening inside. You might think that such a program could only be used for shady purposes, like cracking software license protections or discovering vulnerabilities to be exploited by malware, but in fact there are plenty of perfectly good reasons to use a reversing tool like Olly. Chief among them is what we’re doing right now – reversing your own software (or a client’s) to gain a better understanding of what exactly it’s doing. This might be part of a performance optimization effort, or to make sure the software doesn’t have any obvious vulnerabilities that could be exploited by others. Sections of someone else’s software might need to be reversed if the documentation is lacking or the original publisher has gone out of business. And reversing is central to the work of anti-virus programmers, who must reverse engineer newly discovered malware samples in order to understand them and fight them.
If you want to follow along with this code analysis without installing OllyDbg or messing around with the actual example program, you can view a text document with a disassembly of the relevant code sections. The doc only includes the pieces of code discussed below – the full program is much larger. Otherwise, if you download OllyDbg, and use it to open up the example program, you’ll see a view like this (screenshot from OllyDbg v2.01):
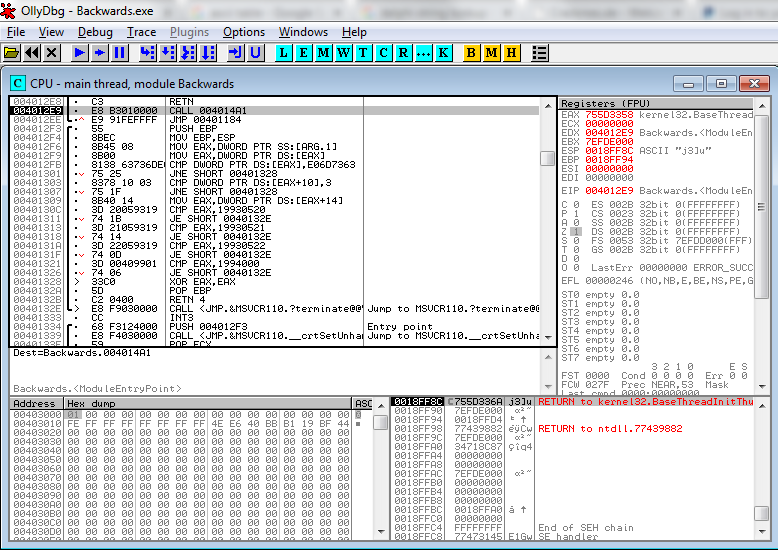
In the upper-left pane, you’ll see a partial disassembly of the program. This is Olly taking the raw bytes from memory and displaying them as x86 assembly instructions – no source code is needed. Looking at a disassembly listing can be a difficult way to understand a program, since any comments or meaningful variable names from the original program source code are gone. Fortunately, Olly does some helpful work for us. References to addresses that Olly recognizes will be replaced with a descriptive name, such as the call to MSVCR110.terminate in the example here. Basic straight line blocks of code are grouped together with a black bar along the left margin – one is shown here, with parts of two others visible. Jumps are displayed with a little red inverted carat symbol v, click on the carat, and an arrow appears that points to the jump destination. Jump targets are displayed with a black > symbol. Click on the symbol, and you’ll see one or more arrows showing all the location that branch to that target. Many other helpful functions can be discovered by right-clicking. Surrounding the the disassembly listing are a live hex dump of memory, a display showing the contents of the stack, and CPU panel showing the current contents of all the registers and flags.
In this case, Olly has highlighted address 004012E9, which is a CALL instruction, because 004012E9 is the entry point of the module as defined in the executable header. More on this later. There’s a ton of code here, and the stuff right at the entry point looks like some kind of boilerplate initialization, so how do we get oriented to find the more interesting parts? One method that’s often helpful is to look for places where strings are referenced. Olly can usually recognize strings, because they consist of long sequences of bytes whose values are all in a particular range (for ASCII strings at least), there are typically assembly instructions that make reference to the start address of the strings, and the strings normally reside in the executable’s initialized data section rather than its code section. It’s not perfect, but right-click Olly’s disassembly view and select Search For -> All Referenced Strings to see a list of all the strings that Olly thinks it’s found. For our example, you’ll see this:
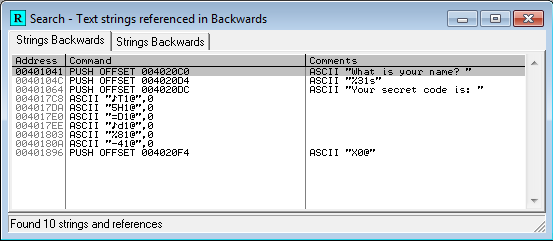
The third string in the list says something about a secret code. Ah ha! Double-click that to jump to the location in the code where the string is referenced:
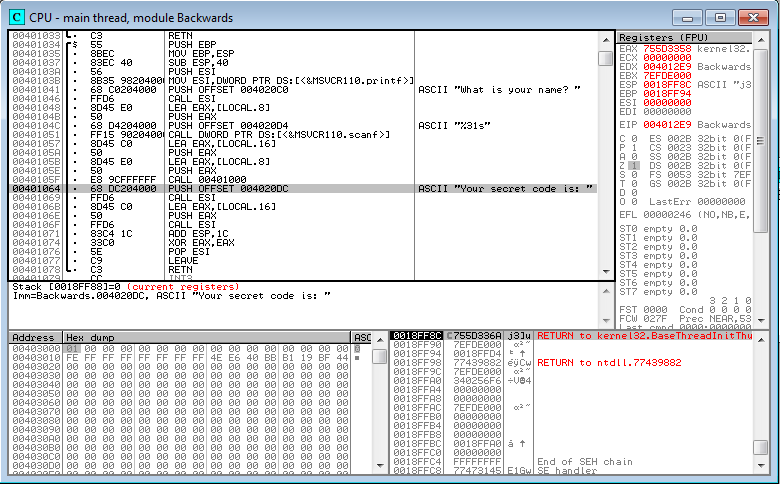
We can see that the string is referenced from a PUSH instruction at 00401064, which is part of a block that begins at 00401034 and ends at 00401078. Let’s examine this block in more detail, starting at the top.
00401034  55            PUSH EBP
00401035  8BEC          MOV EBP,ESP
00401037  83EC 40       SUB ESP,40
The first three lines look like the standard setup at the beginning of a C function. EBP is the CPU’s base register, and ESP is the stack pointer. First the current value of EBP is pushed onto the stack, so that it can be safely modified afterwards, and then eventually restored to its original value when the function returns. The second line is a MOV instruction, and in this x86 syntax, the destination register is always given first. So MOV EBP,ESP means to set EBP equal to the value of ESP, meaning that both now point to the top of the stack. The third line subtracts 40 (64 in decimal) from the stack pointer, reserving 64 bytes for something new. The end result is that EBP now points to the base of a new stack frame, which contains room for 64 bytes of local variables, which have yet to be initialized. ESP points to the top of the stack frame, where new data or additional stack frames may be added later.
I was going to make a nice little diagram showing how a typical stack frame looks, with the arguments to a function call, local variables, ESP, and EBP. But instead I’ll just link this one from exploit.ph:

Moving on to the next section of code:
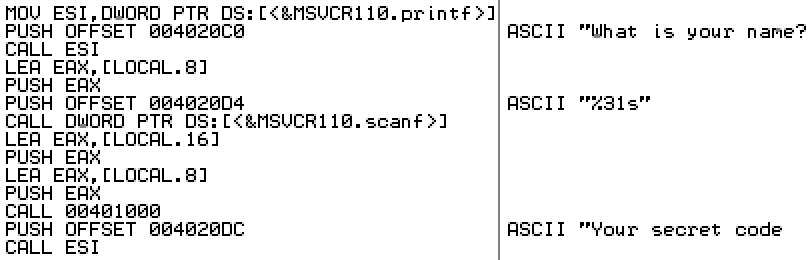
0040103A  56            PUSH ESI
0040103B  8B35 98204000 MOV ESI,DWORD PTR DS:[<&MSVCR110.printf>]
00401041  68 C0204000   PUSH OFFSET 004020C0                      ; ASCII "What is your name? "
00401046  FFD6          CALL ESI
This code saves the current value of ESI so it can be restored later, and then loads ESI with the address of the printf function in the CRT runtime DLL. Next it pushes a fixed address onto the stack. As Olly shows us with a comment, that address points to a string literal in the executable’s initialized data section. You could use the hex dump window to examine address 004020C0 to verify this. Lastly the printf function is called. Printf will take its argument from the top of the stack, obtaining the string address that was pushed earlier, and the string will be printed in the console window.
I’m not sure why the compiler generated an indirect function call here, by loading ESI and later doing CALL ESI. I’m not an x86 guru, but I’m pretty sure CALL DWORD PTR DS:[<&MSVCR110.printf>] would work, and it would avoid needing to save and later restore ESI.
00401048  8D45 E0       LEA EAX,[LOCAL.8]
0040104B  50            PUSH EAX
0040104C  68 D4204000   PUSH OFFSET 004020D4                      ; ASCII "%31s"
00401051  FF15 90204000 CALL DWORD PTR DS:[<&MSVCR110.scanf>]
Next we see an example of the LEA instruction, Load Effective Address. There are a few common ways to move data between registers, using MOV or LEA. This confused me initially. In short, MOV does basic data movement between two registers, or between a register and memory. LEA can also be used to move data between two registers, but is more often used to do pointer arithmetic, say to calculate the address of a specific member of a structure. LEA does not actually read or modify memory, it is only concerned with addresses that reference memory.
MOV EAX, EBX         ; set EAX to the value of EBX. Like a = b assignment in C.
MOV EAX, [EBX]       ; set EAX to the value stored at the memory location pointed to be EBX. Like a = *b.
LEA EAX, [EBX]       ; treat EBX as an address, and set EAX to that address. Equivalent to MOV EAX, EBX
LEA EAX, [EBX+ECX-1] ; calculate pointer arithmetic EBX+ECX-1, and set EAX to the resulting address
In this case, LEA is being used to load EAX with the address of something called LOCAL.8. This is Olly trying to be helpful. It has recognized that this is a reference to one of those local variables, for which 64 bytes of space were reserved earlier. LOCAL.8 is just a placeholder name, and I believe the 8 indicates that it’s 8 longwords (32 bytes) from the base of the stack frame. If you highlight this line, right click, and select Analysis -> Remove Analysis From Selection, you’ll see that this instruction is actually:
00401048 8D45 E0 LEA EAX,[EBP-20]
So it’s calculating the address of the local variable that’s 32 decimal bytes below the base of the stack frame, and storing that address in EAX. Next it pushes that address onto the stack, pushes a format specifier string constant, and calls scanf. Ah ha! So LOCAL.8 must be where the name is stored. The format specifier has a limit of 31 characters to be read by scanf, which when added to the string’s null terminating byte, means that LOCAL.8 is probably a 32 byte buffer.
00401057  8D45 C0       LEA EAX,[LOCAL.16]
0040105A  50            PUSH EAX
0040105B  8D45 E0       LEA EAX,[LOCAL.8]
0040105E  50            PUSH EAX
0040105F  E8 9CFFFFFF   CALL 00401000
Let’s keep going. Next the address of another local variable is pushed onto the stack, followed by the address of the name buffer. Then a mystery function is called at 00401000. We’ll look further at that in a minute.
00401064  68 DC204000   PUSH OFFSET 004020DC              ; ASCII "Your secret code is: "
00401069  FFD6          CALL ESI
Remember that ESI was earlier loaded with the address of the printf function. So this just prints a literal string.
0040106B  8D45 C0       LEA EAX,[LOCAL.16]
0040106E  50            PUSH EAX
0040106F  FFD6          CALL ESI
This prints whatever is in the LOCAL.16 buffer. So that mystery function at 00401000 must have contained some code to fill in that buffer. LOCAL.16 holds the secret code!
At this point we’ve learned enough of what’s happening that we could snoop with the debugger to discover the secret code. Just set a breakpoint at 00401064, and examine what’s in memory at LOCAL.16. But since this example program prints the secret code anyway, that won’t be necessary.
00401071  83C4 1C       ADD ESP,1C
00401074  33C0          XOR EAX,EAX
00401076  5E            POP ESI
00401077  C9            LEAVE
00401078  C3            RETN
The remainder is clean-up code. 1C is added to ESP, to recover the space that was previously reserved for variables. Why add 1C, when the setup code at 00401037 subtracted 40? Shouldn’t it add back the same amount that was subtracted earlier? In fact, the 1C adjustment isn’t there to recover the 40 bytes that were reserved earlier – it’s there to recover the space for the 7 parameters that were pushed for the calls to printf and scanf. 7 parameters at 4 bytes each is 28 decimal bytes, or 1C hex. Next ESI is restored to its original value by popping it off the stack. The LEAVE instruction is what actually recovers the 40 bytes reserved for local variables. LEAVE is equivalent to MOV ESP, EBP followed by POP EBP. This restores the stack and base pointers to the values they had prior to when this function was called.
What about that XOR instruction? Most functions that have a return value will return it in the EAX register, and XOR-ing a register with itself is a common trick for setting the register to 0, because it’s more efficient than MOV EAX,0. In this case, the function has a return value of 0.
OK, so what’s happening in that mystery function at 00401000?
00401000  55            PUSH EBP
00401001  8BEC          MOV EBP,ESP
00401003  53            PUSH EBX
00401004  8B5D 08       MOV EBX,DWORD PTR SS:[ARG.1]
00401007  57            PUSH EDI
00401008  53            PUSH EBX                                  ; /Arg1 => [ARG.1]
00401009  E8 6C000000   CALL <JMP.&MSVCR110.strlen>               ; \MSVCR110.strlen
The function setup is similar to the prior one, with EBP being adjusted. In this case nothing is subtracted from ESP, so it appears that this function doesn’t use any local variables. EBX and EDI are pushed on the stack, so that they can be restored later.
It looks like EBX is being loaded with something from memory called ARG.1. Olly has determined that this is the first argument to the function, and named it accordingly. If you’re curious, you can remove analysis from this line to see that it’s really MOV EBX,DWORD PTR SS:[EBP+8]. Referring to the prior function that called this one, we can see that ARG.1 is the name that was provided by the user.
The address of the name buffer is now in EBX. It’s pushed on the stack, and strlen is called. This will return the length of the name string in EAX.
0040100E  8B7D 0C       MOV EDI,DWORD PTR SS:[ARG.2]
00401011  59            POP ECX
00401012  8BC8          MOV ECX,EAX
00401014  33D2          XOR EDX,EDX
00401016  85C9          TEST ECX,ECX
00401018  7E 12         JLE SHORT 0040102C
EDI gets the function’s second argument, which is the address of the buffer that will hold the secret code. The next two lines pop something into ECX, but then immediately overwrite it with EAX. I believe the POP is just a shortcut for recovering the space that was used for the parameter passed to strlen. The value that’s popped isn’t used here, so it’s equivalent to doing ADD ESP,4.
EAX holds the length of the name string, so now the length is also in ECX. EDX is set to 0 using the XOR trick. The name length is then TEST-ed against itself, and if the result is less than or equal to zero, the next block of code will be skipped. In effect, this surrounds the next block with a test of if (nameLength != 0).
0040101A  56            PUSH ESI
0040101B  8D77 FF       LEA ESI,[EDI-1]
0040101E  03F1          ADD ESI,ECX
00401020  8A041A        /MOV AL,BYTE PTR DS:[EBX+EDX]
00401023  42            |INC EDX
00401024  8806          |MOV BYTE PTR DS:[ESI],AL
00401026  4E            |DEC ESI
00401027  3BD1          |CMP EDX,ECX
00401029  7C F5         \JL SHORT 00401020
0040102B  5E            POP ESI
The next section shows the body of that if() block. It begins and ends by saving and restoring ESI. EDI was previously loaded with the secret code buffer address, and ECX with the name’s length, so the combined effect of the second and third lines is to initialize ESI to a location some distance past the start of the code buffer. The location is ESI = codeBuffer[nameLength-1].
The next six lines form a loop, as indicated by the ASCII-artwork bar to the left of the mnemonics:
- Get the EDXth character from the name buffer. AL is the least significant 8 bits of EAX, so this is a byte-wide MOV instead of a normal 32-bit move.
- Increment EDX by 1.
- Store the character in the code buffer, at the location pointed to by ESI.
- Decrement ESI by 1.
- Compare EDX to the name length.
- If it’s less, continue the loop for another iteration.
It looks like this loop is copying the name string into the secret code buffer, and reversing it in the process.
0040102C C60439 00 MOV BYTE PTR DS:[EDI+ECX],0
Set the secret code buffer to 0 at the offset of the name string’s length, as in codeBuffer[nameLength] = 0. This ensures the secret code string is null-terminated.
00401030  5F            POP EDI
00401031  5B            POP EBX
00401032  5D            POP EBP
00401033  C3            RETN
Clean up and return.
So after all that work, it turns out that the secret code algorithm is just string reverse. I should have made it more challenging! Let’s check it:
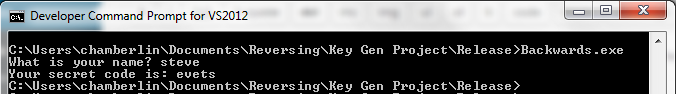
Yup. You probably could have figured it out from the name of the executable. Here’s the source code:
void MakeReverseString(char* in, char* out)
{
    int len = strlen(in);

    for (int i=0; i<len; i++)
        out[len-i-1] = in[i];

    out[len] = 0; // null terminate
}

int main(int argc, char* argv[])
{
    char name[32];
    char backwards[32];

    printf("What is your name? ");
    scanf("%31s", name);

    MakeReverseString(name, backwards);

    printf("Your secret code is: ");
    printf(backwards);

    return 0;
}
Program Bloat?
This entire analysis only covers 120 bytes of executable code. I wanted to discuss the executable header, the C runtime, and the contents of that 6144 bytes of bloat, but this post has already reached epic length. I’ll save those stories for tomorrow!
You can download the example program here.
Read 1 comment and join the conversation1 Comment so far
Leave a reply. For customer support issues, please use the Customer Support link instead of writing comments.
Not exactly related, but here’s a small x86 DOS assembly program that blew my mind recently :
VZNNXPH555750K4PP5DM3D01D0X5AC3D21D2XP559550K4
Yep, that’s the binary, using only valid ascii opcodes…
No idea how it work though.