

Backwoods Logger

Explore temperature, altitude, and pressure data while on the move! The Backwoods Logger is designed for hikers, backpackers, climbers, skiers, trail runners, cyclists, kayakers, and other outdoorsy people interested in environmental data graphing over timescales from an hour to a few weeks. It’s a programmable open source design, so you can hack it, tweak it, make it yours!
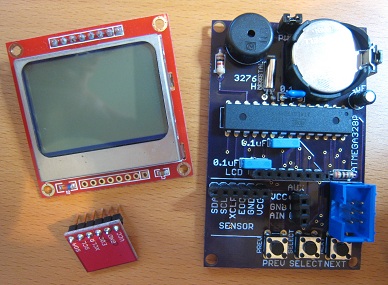
The Backwoods Logger is available in two versions – the preassembled Logger Mini, and the Logger Classic Kit. Both versions use the same sensor and have the same capabilities.
Features
- Graphs of temperature, pressure, and altitude over time
- Three graph time scales: past 2 hours, past 10 hours, past 2.5 days
- Current rate of ascent/descent
- Estimated time of arrival at a user-defined altitude
- Weather forecast
- Station pressure and pressure at sea level
- Snapshot feature – make a permanent record of date, time, altitude, temperature, and pressure at important waypoints
- Current date and time display
- Imperial or metric units option
- Battery voltage indicator
- Sound on/off control
- 3 to 6 month battery life, depending on usage
- Temperature measurements in 0.5 degree steps, from -10F to 117.5F (-23C to 48C)
- Air pressure measurements in 0.01 in-Hg steps, from 5.9 to 36.12 in-Hg (170 to 1250 millibars)
- Altitude (calculated from air pressure) measurements in 2 ft steps, from -1384 ft to 14999 ft (-300 to 4500 meters)
- Download graph data to your PC using the optional BLsync�adapter
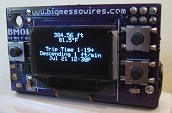
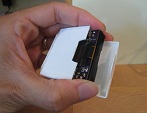
- Mini: 128 x 64 white OLED display, 48 x 28 x 17 mm, 19g including AAA battery
- Classic: 84 x 48 LCD display, 73 x 49 x 19 mm, 48g including CR2032 battery
Background
I developed the Backwoods Logger here at Big Mess o’ Wires, and tech details and progress reports can be found in the development blog. The Logger is now an open hardware project hosted by GitHub. Visit the project home page to get�all the firmware source code, schematics, board layouts, Gerbers, parts lists, and everything else you need.
The Classic uses all through-hole components, an 84 x 48 LCD screen, and a 3V CR2032 coin battery. The Mini uses all surface-mount components and is about half the size of the Classic. It uses a 128 x 64 OLED screen and a 1.5V AAA battery with a DC boost converter circuit to generate 3V. Both devices use an ATMega328P microcontroller and a Bosch BMP085 pressure/temperature sensor.
Pressure, temperature, and altitude samples�(computed from pressure) are taken once per minute. Short-term sample history is maintained in RAM, and longer term history in EEPROM to survive battery replacement or reset. Custom software displays graphs of historical sample data, and enables sample-by-sample examination of the graphs.
Power
The Backwoods Logger is an always-on device, recording a new data measurement every minute. There is no on-off switch. The device sleeps between each sample to conserve power, and battery life is 3 to 6 months.
Locking and Unlocking
To prevent unwanted actions resulting from accidental button pushes, the Logger is normally locked, and all menus and screens are disabled. To unlock the Logger, hold the PREV and NEXT buttons simultaneously.
After a period of inactivity, the Logger will automatically turn off the display and lock itself. The delay before auto-locking occurs can be configured in the System menu.
Navigating Screens and Menus
The Logger functions are organized into a list of 10 screens. You can move back and forward between screens in the list by pressing the PREV and NEXT buttons. The screen list is circular, so if you reach the end of the list, you will wrap around to the beginning.
Many screens have menus. To access a screen’s menu, press SELECT while viewing the screen. Navigate between menu options using the PREV and NEXT buttons, or select the Exit Menu option to return to the screen.
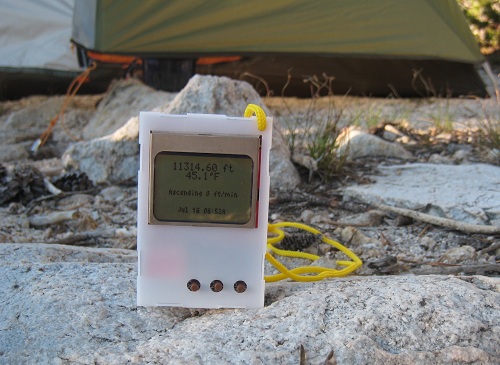
Main Screen
The main screen can be configured to show up to six different user-defined measurements, one per line. To choose which measurements to show, enter the screen’s menu by pressing SELECT, and then choose which of the six lines to configure. The choices are:
- Temperature
- Altitude
- Rate of ascent – average over the past 10 minutes
- Estimated time to destination altitude – set the destination altitude in the Altitude screen
- Station pressure – the absolute air pressure measured by the BMP085 sensor
- Sea level pressure – air pressure converted to a sea level equivalent
- Time of day
- Date and time
- Temperature trend – rising/falling/steady trend over the past hour
- Pressure trend – rising/falling/steady trend of station pressure over the past hour
- Weather forecast – a simple weather forecast based on pressure changes over the past five hours
- Empty – clears the line and displays nothing
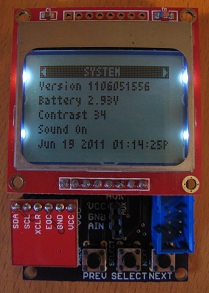
System Screen
The System Screen displays a variety of Logger diagnostic data, and the screen’s menu consists of general setup options and preferences. The displayed diagnostics are:
- Version – software version number
- Battery – current battery voltage- replace the battery is below 2.7V for the Classic, or below 1.1V for the Mini.
- Contrast
- Sound on/off
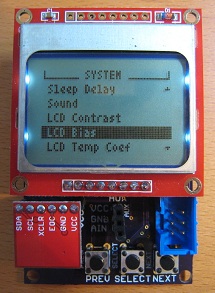
Access the menu by pressing SELECT. The System menu options are:
- Units – metric (Celsius, meters, millibars) or imperial (Farenheit, feet, inches of mercury)
- Date and time – set the current date/time
- Sleep delay – configure the inactivity delay before the Logger auto-locks
- Sound – turn UI feedback and alarm sounds on and off
- LCD contrast – adjust the screen contrast
- LCD bias (Classic only) – sets the LCD’s bias voltage, which acts sort of like a coarse adjustment for contrast
- LCD temp coef (Classic only) – sets the LCD’s temperature-compensated contrast adjustment
- Restore defaults – restore all settings to their default values, but do not erase any data
- Erase all data – erase all stored altitude, pressure, temperature, and snapshot data
Snapshot Screen
In addition to the normal once a minute data samples, you can also make a data snapshot whenever you’d like. The snapshot records the current date, time, altitude, temperature, and pressure. Unlike normal data samples, snapshots are preserved forever (until erased or overwritten), and are a fun way to record important points like the top of a major summit.
The Snapshot screen shows data from the most recent snapshot, if any. To take a new snapshot, enter the Snapshot menu by pressing SELECT, and choose the Take Snapshot menu option. To view and examine the list of stored snapshots, enter the Snapshot menu and select View Snapshot Log. You can scroll through the entries in the log using the PREV and NEXT buttons.
The Logger Mini has storage for 62 snapshots, and the Logger Classic stores 84 snapshots. When the snapshot list is full, taking a new snapshot will replace the oldest snapshot in the list.
Altitude
The main altitude screen shows the current altitude and rate of ascent. If a goal altitude is defined, the screen also shows the goal altitude and the estimate time to destination. The Altitude menu, entered by pressing SELECT, provides access to two important settings:
- Calibrate – Sets the current true altitude. This establishes a known point on a mathematical curve of air pressure vs altitude that’s used to make later altitude determinations. Calibrate the Logger every few days to compensate for air pressure changes due to local weather patterns. An uncalibrated Logger may report altitudes that are inaccurate by hundreds of feet.
- Set/Reset destination – sets or clears the goal altitude, used to estimate the “Time to Destination” shown on the main screen.
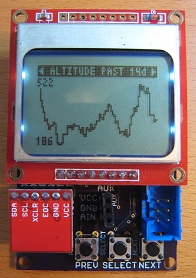
The other altitude screens consist of three graphs showing altitude vs time at different time scales. Graphs are discussed separately below.
Temperature
The main temperature screen shows the current temperature, rate of temperature increase/decrease in the past hour, and general rising/falling/steady trend in the past hour. There is no menu for the temperature screen.
The other temperature screens consist of three graphs showing temperature vs time at different time scales. Graphs are discussed separately below.
Pressure
The main pressure screen shows the current station pressure (absolute pressure from the BMP085 sensor), rate of station pressure increase/decrease in the past hour, general rising/falling/steady trend in the past hour, sea level pressure (station pressure converted to a sea-level equivalent), and a simple weather forecast based on pressure changes over the past five hours. There is no menu for the pressure screen.
The other pressure screens consist of three graphs showing pressure vs time at different time scales. Graphs are discussed separately below.
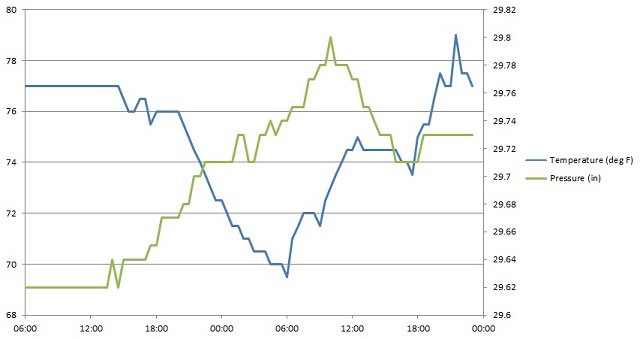
Graphs
For each of the three data types (altitude, temperature, and pressure), there are three graph screens that display data vs time for different time scales. For the Logger Classic, these time scales are past 90 minutes, past 8 hours, and past 2 days. For the Logger Mini, the time scales are past 2 hours, past 10 hours, and past 2.5 days. By default, the Y-axis minimum and maximum values are automatically set based on the graphed data.
Press the SELECT button to enter the graph menu. The menu options are:
- Explore graph – overlays a crosshair onto the graph, which can be moved using PREV and NEXT to examine graph details and get the exact data value at any point on the graph. Exit explore mode by pressing SELECT.
- Drawing style – display the sample data as connected lines, or disconnected points
- Custom/Auto Y-axis min – set or reset a custom minimum value for the Y-axis
- Custom/Auto Y-axis max – set or reset a custom maximum value for the Y-axis
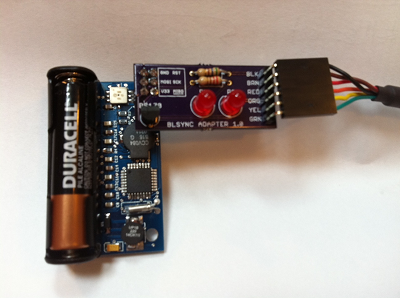
BLsync
The BLsync adapter and companion command-line program for Windows are used to transfer data from a Logger to a PC. An FTDI USB-to-serial adapter is also required, such as this one from Sparkfun.
The latest version of the BLsync utility program is included with each Backwoods Logger software release, which can be downloaded from https://github.com/steve-chamberlin/backwoods-logger.
Plug the blsync adapter into the Logger’s ISP port, and connect the USB-to-serial converter to the blsync adapter’s 6-pin header. Be careful not to insert either one backwards, or you may damage the Logger. When connected correctly, the blsync adapter should extend out and away from the Logger, and should not overlap the Logger or battery.
Open a command prompt window, and run the blsync.exe program. Under Windows, a command prompt can be opened by:
- Click the taskbar’s Start button (the Windows logo button)
- Type “cmd” into the “search programs and files” box, and press Enter.
Blsync can retrieve the Logger’s firmware version number, temperature / altitude / pressure graphs, and snapshot list. Data can be saved in CSV format for importing into Excel, or as raw binary.
The blsync utility is configured using command line options:
Usage: blsync -p port [-b speed] [-v] [-c] [-r] [-g filename] [-s filename]

    -p port       Port to use for Logger communication, such as COM1.

    -b speed      Bit rate for communication. Default is 38400.

    -v            Display the Logger firmware version number.

    -c            Save files in CSV format. This is the default.

    -r            Save files in raw binary format instead of CSV.

    -g filename   Sync the graph data, and save it to the named file.

    -s filename   Sync the snapshot data, and save it to the named file.
For example, to sync the temperature, altitude, and pressure graphs from the Logger connected to COM3, and save them in CSV format to the file graphs.csv, the command line would be:
blsync.exe -p COM3 -c -g graphs.csv
By importing the CSV file into Excel or another analysis program, you can quickly create graphs and charts from the Logger data.
Links
- User guide
- Project home page at GitHub
- Backwoods Logger mailing list
![]()
4 Comments so far
Leave a reply. For customer support issues, please use the Customer Support link instead of writing comments.
I’ll be hiking the JMT this summer and if you need (or want) so product testing I’d love to carry it along for the ride.
It looks great, I just wish I had the time to delve into a project such as this.
Just a thought,
Good thought – I took the original prototype on the JMT in 2011: http://www.bigmessowires.com/2011/08/11/logger-mini-on-the-john-muir-trail/
Hi
I postet a blog entry about this great tool today.
http://rubines.blogspot.co.at/2013/07/backwoods-logger.html
Hope you like it.
Cheers
Rubi
Very nice project. Have you ever considered adding GPS logging? Would it be better to use a separate GPS logger and merge the log data?