
ESP8266, Freeboard.io, Blynk, and IoT
The ESP8266 has exploded in popularity since its introduction a few years ago. With easy to use Arduino-compatible modules like the Wemos D1 Mini, it’s like having an Arduino that’s 5-10x faster, has 128x more memory, and has built-in WiFi, all for the ridiculously cheap price of $4. It’s pretty amazing stuff, really.
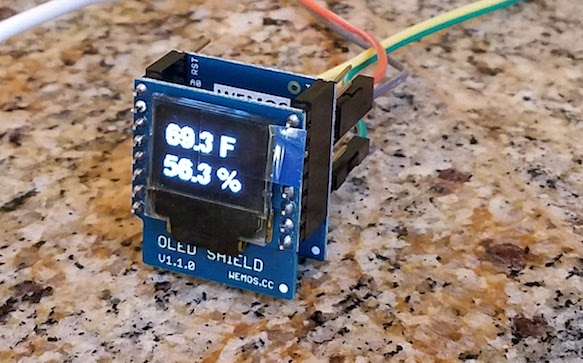
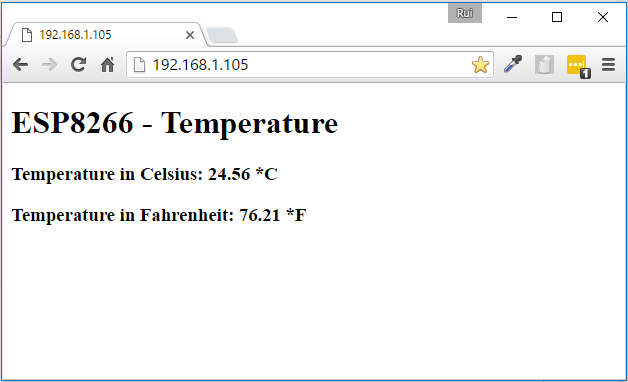
Like everyone else, I began my ESP8266 adventures with a temperature logging application. Using the D1 Mini, an OLED display shield, and an SHT30 temperature/humidity sensor shield, I was able to create a working temperature monitor in about 15 minutes. It shows the current temperature and humidity on the display, and also runs a basic web server for remote viewing of the data. The only hiccup was the heat generated by the ESP8266, which was enough to raise the temperature about 10 degrees F above ambient temperature when the SHT30 shield was plugged directly into the D1 Mini base. Separating the modules with hookup wires solved that problem. The result was something like this:
Logging and Displaying IoT Data
That’s great for a few minutes of work, but how can I make a single page that shows data from many sensors? Or historical data showing the temperature trend over the past 24 hours? Or a more attractive visualization UI than plain text? Or bidirectional control – the ability to switch some equipment at the sensor on/off? This is the realm of IoT data logging and display dashboard solutions, and there are many options.
One approach is to run a local server to do the job, like a Raspberry Pi or an old PC. There are lots of options for software packages you can install on the server, which will log the data and serve up nice-looking pages to visualize it. I didn’t explore this route, because I was too lazy. I also dislike the idea of connecting to a random 192.168.1.8 server address that changes every time my home network reassigns the address through DHCP. I’m sure there’s a way to give it a fixed address and name like “weather-info.local”, but I didn’t look into it.
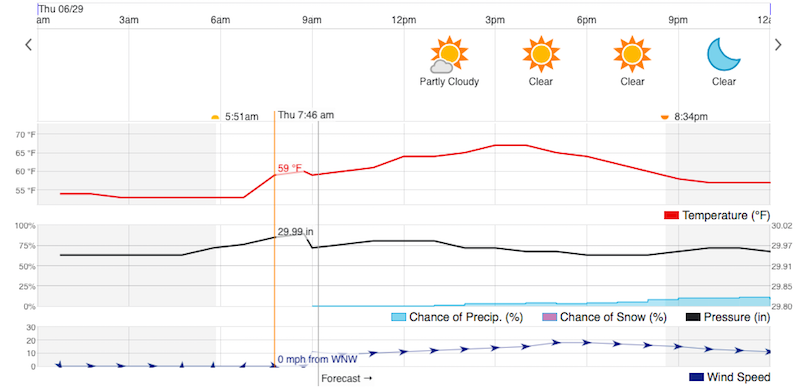
There exist a dizzying number of cloud-based logging and visualization solutions. My ideal solution would would have a nice-looking historical graph of the data, with an adjustable time scale, like the example below from Weather Underground. And of course it would be easy to integrate into my ESP8266 software, and cheap or free to use.
I’ve yet to find any solution that I love. Here’s a quick run-down of the cloud-based options that I investigated.
Dweet.io and Freeboard.io
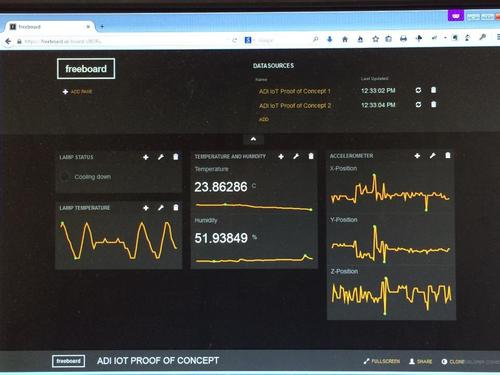
Dweet.io is the data logging service, and Freeboard.io is the dashboard display service. Judging from how frequently they’re mentioned in tutorials and instructables, they’re quite popular. You can also install Freeboard on a local server if you prefer. This setup is for data visualization only, and doesn’t allow for control over the sensor device.
The combination of Dweet plus Freeboard is easy to use, and it looks nice. It would be a great solution except for one shortcoming: there’s no real support for historical data. Freeboard can display sparklines, which are a sort of mini-chart where nothing is labeled and the history is retained in the chart widget itself. Close the web page and re-open it, and your history is gone.
There is an option for a Historical Graph Widget in Freeboard, but it requires upgrading to a paid Dweet Pro account for data storage. That’s only $2/month, but as far as I can tell it means you need to pay before you can try out the historical graph to see if it’s any good. From the screenshots I’ve seen of it, the time axis isn’t labeled and the time scale can’t be modified. It also appears designed to graph a fixed range of historical data, like June 10, rather than a window like past 24 hours.
Freeboard can be extended with plugins, and there are several attractive graphing plugins available. However, all of them appear to function like the sparkline, with the history retained in the graph widget instead of coming from the data source. There may be a solution to do what I need with Freeboard, but I couldn’t find it.
Blynk
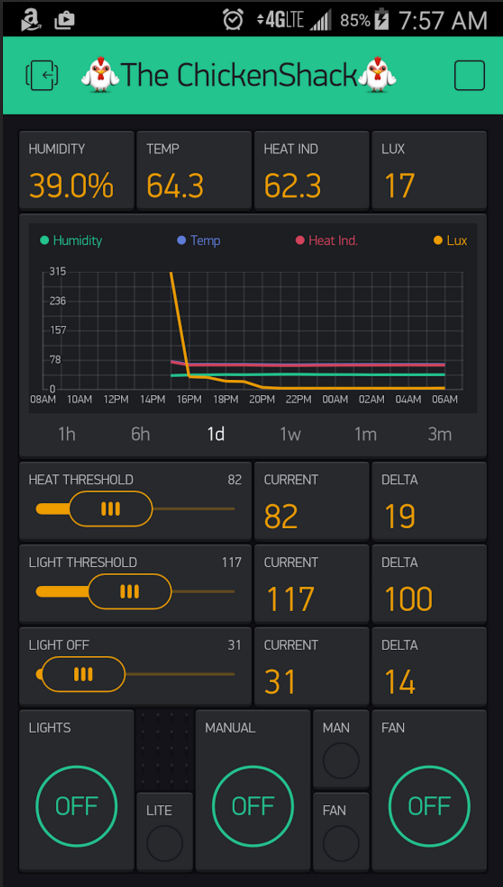
Blynk combines the data logging and dashboard display into a single service. It also provides support for control over devices, in addition to displaying data received from them. Along with Freeboard, it seems to be one of the most popular IoT visualization solutions. It’s easy to use, and attractive.
My biggest complaint about Blynk is that visualization and control is accomplished entirely through mobile apps. There is no facility for viewing your data in a web page – everything happens on your phone or tablet. For some people that might be fine, but I strongly prefer a regular computer with a larger screen and easier control over a complex UI.
The Blynk historical graph widget does almost exactly what I want, with an adjustable timescale showing anywhere from the past 1 hour to past 3 months. But the graph is tiny, and can’t be zoomed or enlarged. It also lacks a cursor feature to display the exact value from some time in the past – you have to eyeball the graph and estimate it. When the whole point of the temperature logger dashboard is to dig into the historical data, it’s disappointing.
Blynk uses an “energy” metaphor that I find to be confusing and silly. Each type of widget added to your dashboard requires a different amount of energy, which must be paid for with an in-app purchase. I would prefer a more straightforward monthly subscription model, with the cost based on things like the number of dashboards and amount of data stored. Charging 2x the energy for a data field display with units vs one without units has no correlation to the developer’s actual costs, and makes me feel like I’m playing Farmville.
Adafruit.IO
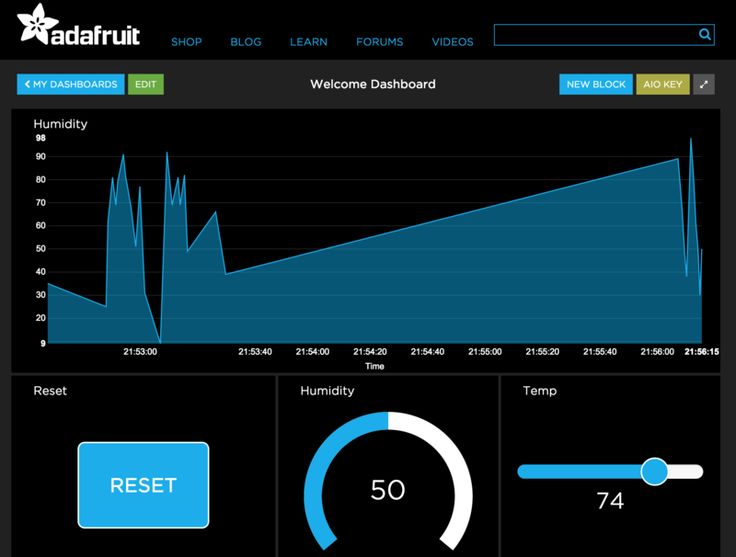
Adafruit.IO is technically still in beta, although it’s open to everyone and has been around for a couple of years. Like Blynk it combines data logging and display, and provides support for both data display and device control. But like Freeboard it’s web-based rather than mobile. Could this be the perfect solution?
From my limited testing it looks promising. The historical graph widget works as expected, and my only gripe is that the time scale must be chosen when the graph is created, so you can make a “past 60 minutes” graph or a “past 24 hours” graph, but not a single graph with an adjustable time scale.
I’m uncertain what the future holds for Adafruit.IO, or whether it’s still being actively developed and maintained. Since the service is completely free, and has been in beta for over two years, it has the feel of a project that was created with great enthusiasm but was left to languish when the developers moved on to something new. Assuming it doesn’t unexpectedly break or get shut down, it looks like a nice solution.
Cayenne
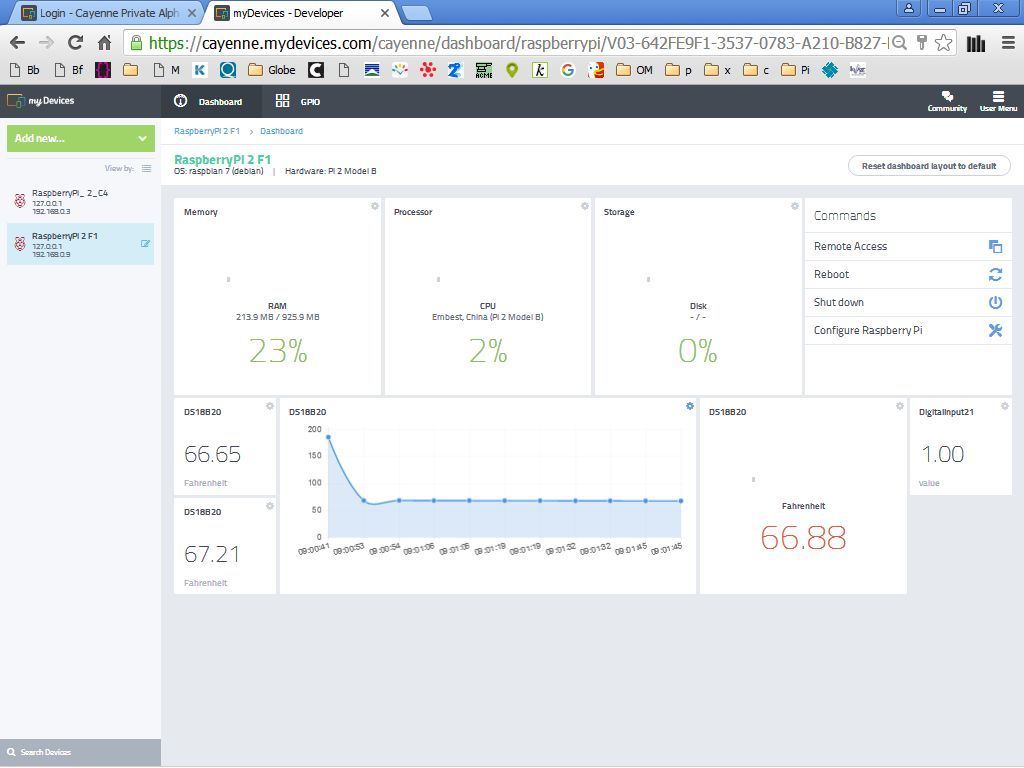
Cayenne is another web-based logger and dashboard like Adafruit.IO. It was recommended in a recent Sparkfun blog post, but I couldn’t find many examples of people using it. Unlike the other services I’ve mentioned, Cayenne appears to be an “app builder” whose goal is to avoid needing to write any code. Instead you use a web GUI to define what type of microcontroller you’re using, what kinds of sensors, and how they’re connected, and then it spits out a complete sketch you can paste into the Arduino IDE. You can probably guess that I’m not too enthusiastic about this approach. Under the hood, the auto-generated code appears to use something very similar to the Blynk API for communicating with the Cayenne server.
I stopped short after reading some Cayenne docs and videos, and never actually tried to integrate it. Maybe I should give it another try, as screenshots of its graphing functions look quite nice. If I can ignore the app builder and auto-generated code, and just use it as a normal API, it might be OK.
A few other alternatives I looked at only very briefly:
Thingspeak – Somehow related to MATLAB, and geared towards doing extensive analysis of the collected data. Might be OK? Most of the references I found were several years old, and I have the impression it’s been eclipsed by some of the newer alternatives.
Emoncms – Looks somewhat promising, but I think it’s only for local server installs and doesn’t have a cloud service.
Losant – Appears geared towards large scale businesses, not makers and home temperature loggers.
Easy IOT – Didn’t make a great first impression – many typos in documentation, complicated setup compared to the other options.
Analog.io – Minimal information on the web page, links to a Hackaday project that hasn’t been updated in a couple of years.
Have you ever used these tools or others like them? I’d love to hear from you – leave a note in the comments.
Read 11 comments and join the conversation11 Comments so far
Leave a reply. For customer support issues, please use the Customer Support link instead of writing comments.
I tried many of these and ended up with Losant. I used it back before their pricing came into existence, but I was pretty happy with the amount of customization it offered. If you’re ok with only the 30 day data retention, then I think you’ll like using it.
Thanks for the tip! I did an integration with Losant, and so far it seems great – much more capable and customizable than the other options I looked at. My only disappointment is that I can’t change the time scale of a graph after it’s created. So I’ve got three different graphs on my dashboard, showing the same data at 1 hour, 24 hour, and 7 day time scales.
Sparkfun also has a logging service: https://data.sparkfun.com/
They’re pretty responsive to requests. I would go on the forum and ask if there’s an easy way to change the the time scale. Otherwise you might be able to write some JavaScript that adjusts the scale on the fly.
Sorry for the wall of text and self promotion,
May I humbly suggest taking a look at my Pi Gateway software, which runs on your own RaspberryPi cloud.
My main goal was to keep the “cloud” in my own 100% control, and use ultra low power RFM69 radios for motion sensors, light switches, T/H/P sensors, mailbox and sump pump monitoring, sprinklers control, garage doors monitoring and control, also supports an open API wi-fi thermostat which I use. You can setup SMS/email alerts for varoius events.
It is real-time websocket over HTTPS with authentication, allows historical data with customizable flot graphs that has no data log limit, viewing is ultra fast via data aggregation even over mobile connection. All in a nice mobile friendly web interface that requires no app on your phone (just your IP to acceess it). The only “limitation” is that you have to spend the time to set it up on your Pi and understand how it works. There are some nice hardware options that can accompany it like a MightyHat for the Pi to make a nice Pi gateway with battery backup and power control, but you can use it with as little as a Moteino/arduino with RFM69 to receive the data, or any other device which could produce the recognized serial tokens which become logged or produce actions (ex “MOTION” or “TEMP:75F” etc).
https://lowpowerlab.com/guide/gateway/
https://lowpowerlab.com/guide/mightyhat/
I like your feature request Steve, and since I had an account, I went ahead and wrote the request for you: https://forums.losant.com/t/adjust-time-series-graph-duration-on-the-fly/535 Hope you don’t mind me copying your text.
@Dillon thanks for requesting the time scale graph feature. That would be great if Losant could add it.
@Felix the Moteino plus Pi Gateway combination looks great! I’d been to your site several times before, but hadn’t quite grasped what the Moteino was all about beyond being an RF transmitter of some kind. It looks very nice for applications where you need longer range or lower power consumption than you can get with WiFi-connected sensors. How would you use the Moteino with RF radio if you don’t have the Pi Gateway? Would you need two Moteinos, with one connected to a PC by USB to relay and store the data somehow? The “All About Moteino” page refers to a Gateway example, but without actually downloading and installing the example code I’m unclear how a minimal logging+viewing application would work.
Steve,
I created the Moteino to be a low power general purpose arduino board with the RF option so it can run on small batteries for years. The output is serial and it acts just like any arduino. So it can be hooked to any computer to receive data from another Moteino if both have the RF module installed. For the home automation I created the Gateway UI software so it can run on a small low power but capable computer like a Pi, and act as a central brain for the automated property. It uses a serial port as the communication to the rest of the network so it’s not necessarily dependent on Moteinos – it just hooks into a serial/COM port of the host computer. You could use at least 2 Moteinos to create an RF network link (one would be the permanent relay or “gateway”) the other would report some data periodically or control some device (check out my SwitchMote). The clear advantage of the FSK radios is having much better penetration and very long range vs. wifi (lately LoRa RFM radios are even better at this), and of course the ultra low power aspect, no dependency on a router etc. The ESP Wifi radios will be spotty at best in a big house with sensors in walls and all over the property. I tried all these things and I evaluated existing platforms like you did above before I started all this adventure years ago. It was a hobby then and turned business in the meantime.
Check out the videos that are on the gateway guide page where you can see some reviews of the software:
https://www.youtube.com/watch?v=F15dEqZ4pMM
https://lowpowerlab.com/guide/gateway/
A quick glance at MightyHat on a Pi, browsing RF messaging and setting the LCD brightness: https://www.youtube.com/watch?v=4D_XP2MArZw
Have you checked out the esp32?
I was/am intending to try it out for a things that need more IO than the ESP8266 has… and the ESP32 does have plenty of IO… and 2 CPUs which leads to a more stable software design and more available CPU time as well.
Warning, I’m a .NET dev so my slant has been towards the Microsoft stack.
While likley overkill for the ESP8266, I’ve used the Azure IoT hub for a couple of data-logger projects. For most hobby projects the free tier should be more than capable. https://github.com/Azure-Samples/iot-hub-c-huzzah-getstartedkit
I think you can get $25/month credits for azure through the Dev Essientials pack too https://www.visualstudio.com/dev-essentials/
Just came across this excellent evaluation from 2017 BUT has it ever been updated here or elsewhere ?
Cheers